MLPerf Storage Benchmark Setup and Interpretation for AI Inference Workloads
A practical guide to running MLPerf Storage v3.0 for inference.
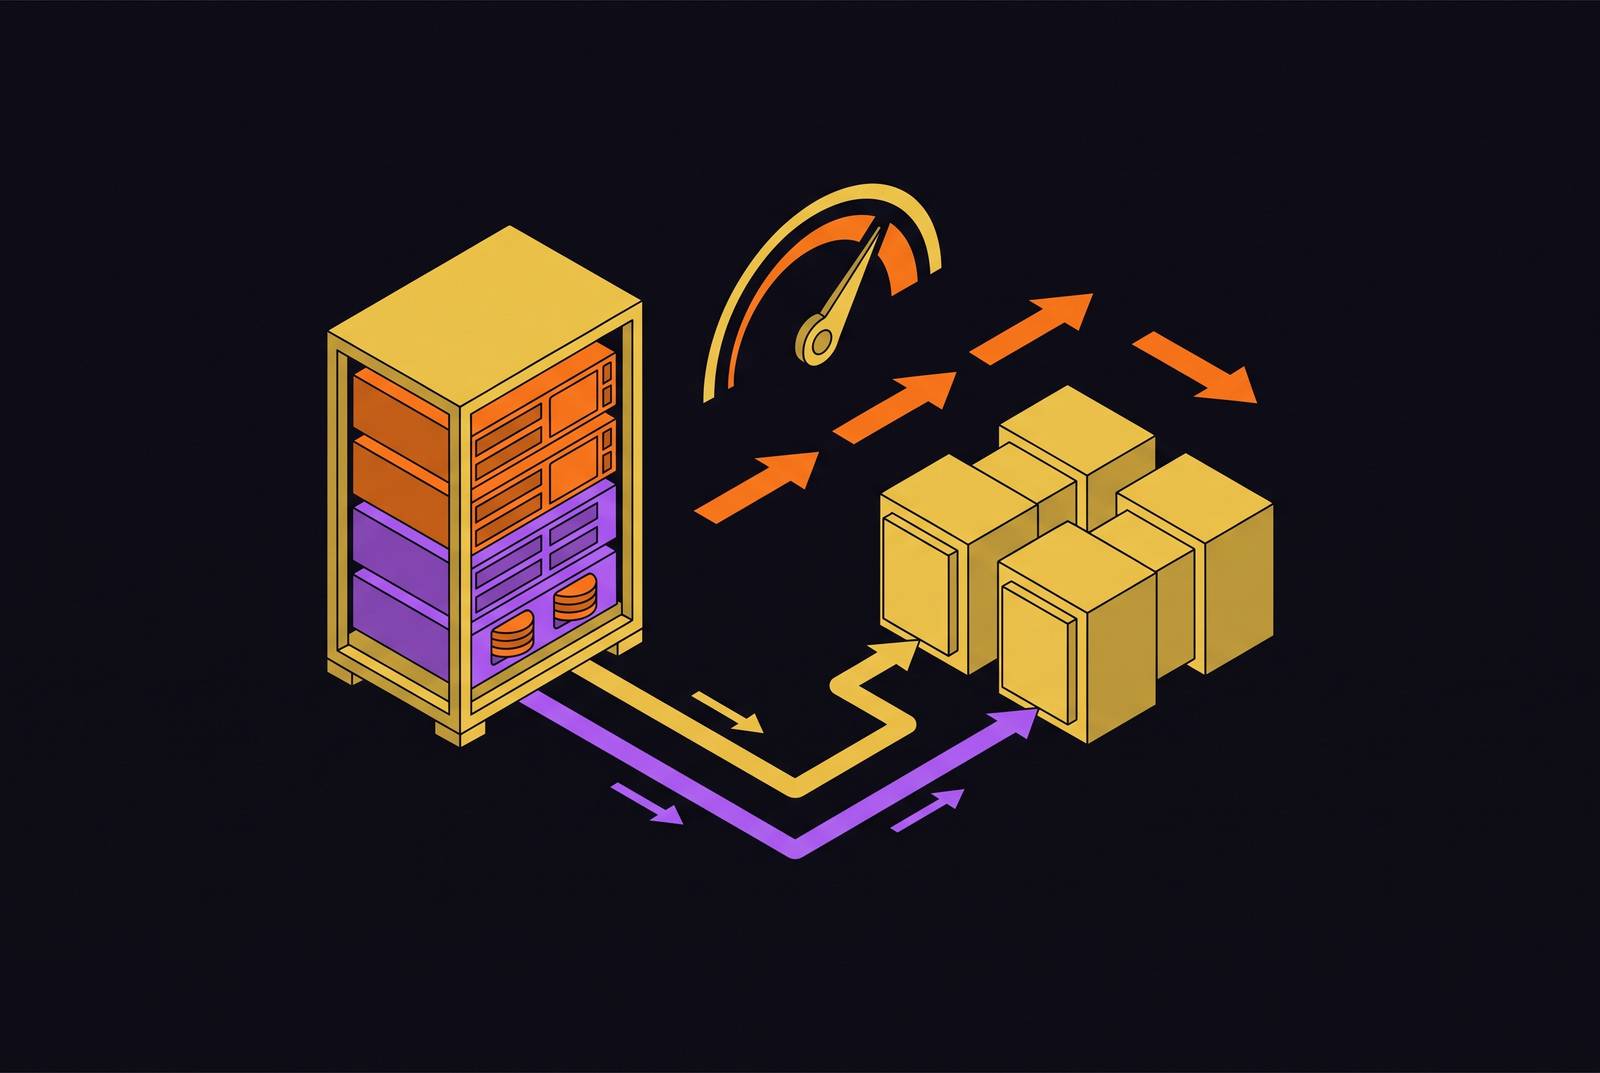
This article walks practitioners through the full process: environment configuration, workload selection, result interpretation, and how to translate benchmark numbers into real infrastructure decisions for AI inference.
The benchmark itself came out of five years of joint engineering work involving 35 storage vendors and academic groups, coordinated under MLCommons MLCommons Releases New MLPerf Storage v3.0 Benchmark Results. The goal was never abstract. Storing, moving, and serving data into machine learning frameworks can bottleneck training and inference just as badly as a slow accelerator can, and it drives resource costs right alongside compute. Yet storage has spent years getting a fraction of the specialized attention that compute has received in the ML tooling world, despite functioning as a very real ceiling on system performance.
That cadence matters on its own: this isn't a benchmark someone published once and walked away from. This version lineage shows the suite is actively maintained. Everything that follows in this piece, every setup detail and every metric, is really evidence for one underlying claim: storage is a bottleneck that deserves the same rigor compute has already gotten, and the benchmark exists to make that bottleneck visible and measurable.
What changed in v3.0 for LLM inference teams
MLCommons put out the v3.0 results on September 1, 2026. The headline structural change is that the suite now covers four distinct workload types instead of a narrower training-only set, splitting cleanly into training-side tests (Training and Checkpointing) and inference-side tests (KV Cache and Vector Database). That's the real payoff of the redesign. Instead of one blended number, teams get workload-specific signals they can actually act on.
The KV Cache test is new, and it measures storage performance for the read and write operations LLM inference caches perform constantly. KV caching itself has been around for a while. It's the standard technique transformer-based autoregressive models use to avoid recomputing key-value attention matrices at every decode step. What's new is that MLPerf Storage now has a dedicated way to measure how storage performs under that specific pattern. The Vector Database test is also new, targeting the indexing and querying workloads behind AI applications that store high-dimensional, unstructured data. And v3.0 adds an S3 object storage access layer alongside the POSIX layer that's existed all along, with roughly one in six of all v3.0 submissions using S3 MLCommons Releases New MLPerf Storage v3.0 Benchmark Results. Curtis Anderson, another working group co-chair, put the stakes of that addition directly: "As the scale of AI contexts reaches into the trillions, we expect object-based storage systems to emerge as a viable, and possibly preferred, alternative to filesystem-based storage" MLCommons Releases New MLPerf Storage v3.0 Benchmark Results.
Nineteen organizations submitted results this round, and eleven of them were first-timers, a sign the benchmark is reaching further into the storage ecosystem than it used to MLCommons Releases New MLPerf Storage v3.0 Benchmark Results MLCommons Releases New MLPerf Storage v3.0 Benchmark Results. Every prior round of MLPerf Storage was built around training workloads. This is the first version that speaks the language of inference serving directly. As working group co-chair Brian Belgodere put it, decomposing monolithic AI systems into specific storage patterns "gives stakeholders a much clearer idea of how to engineer and provision AI systems to minimize storage performance bottlenecks".
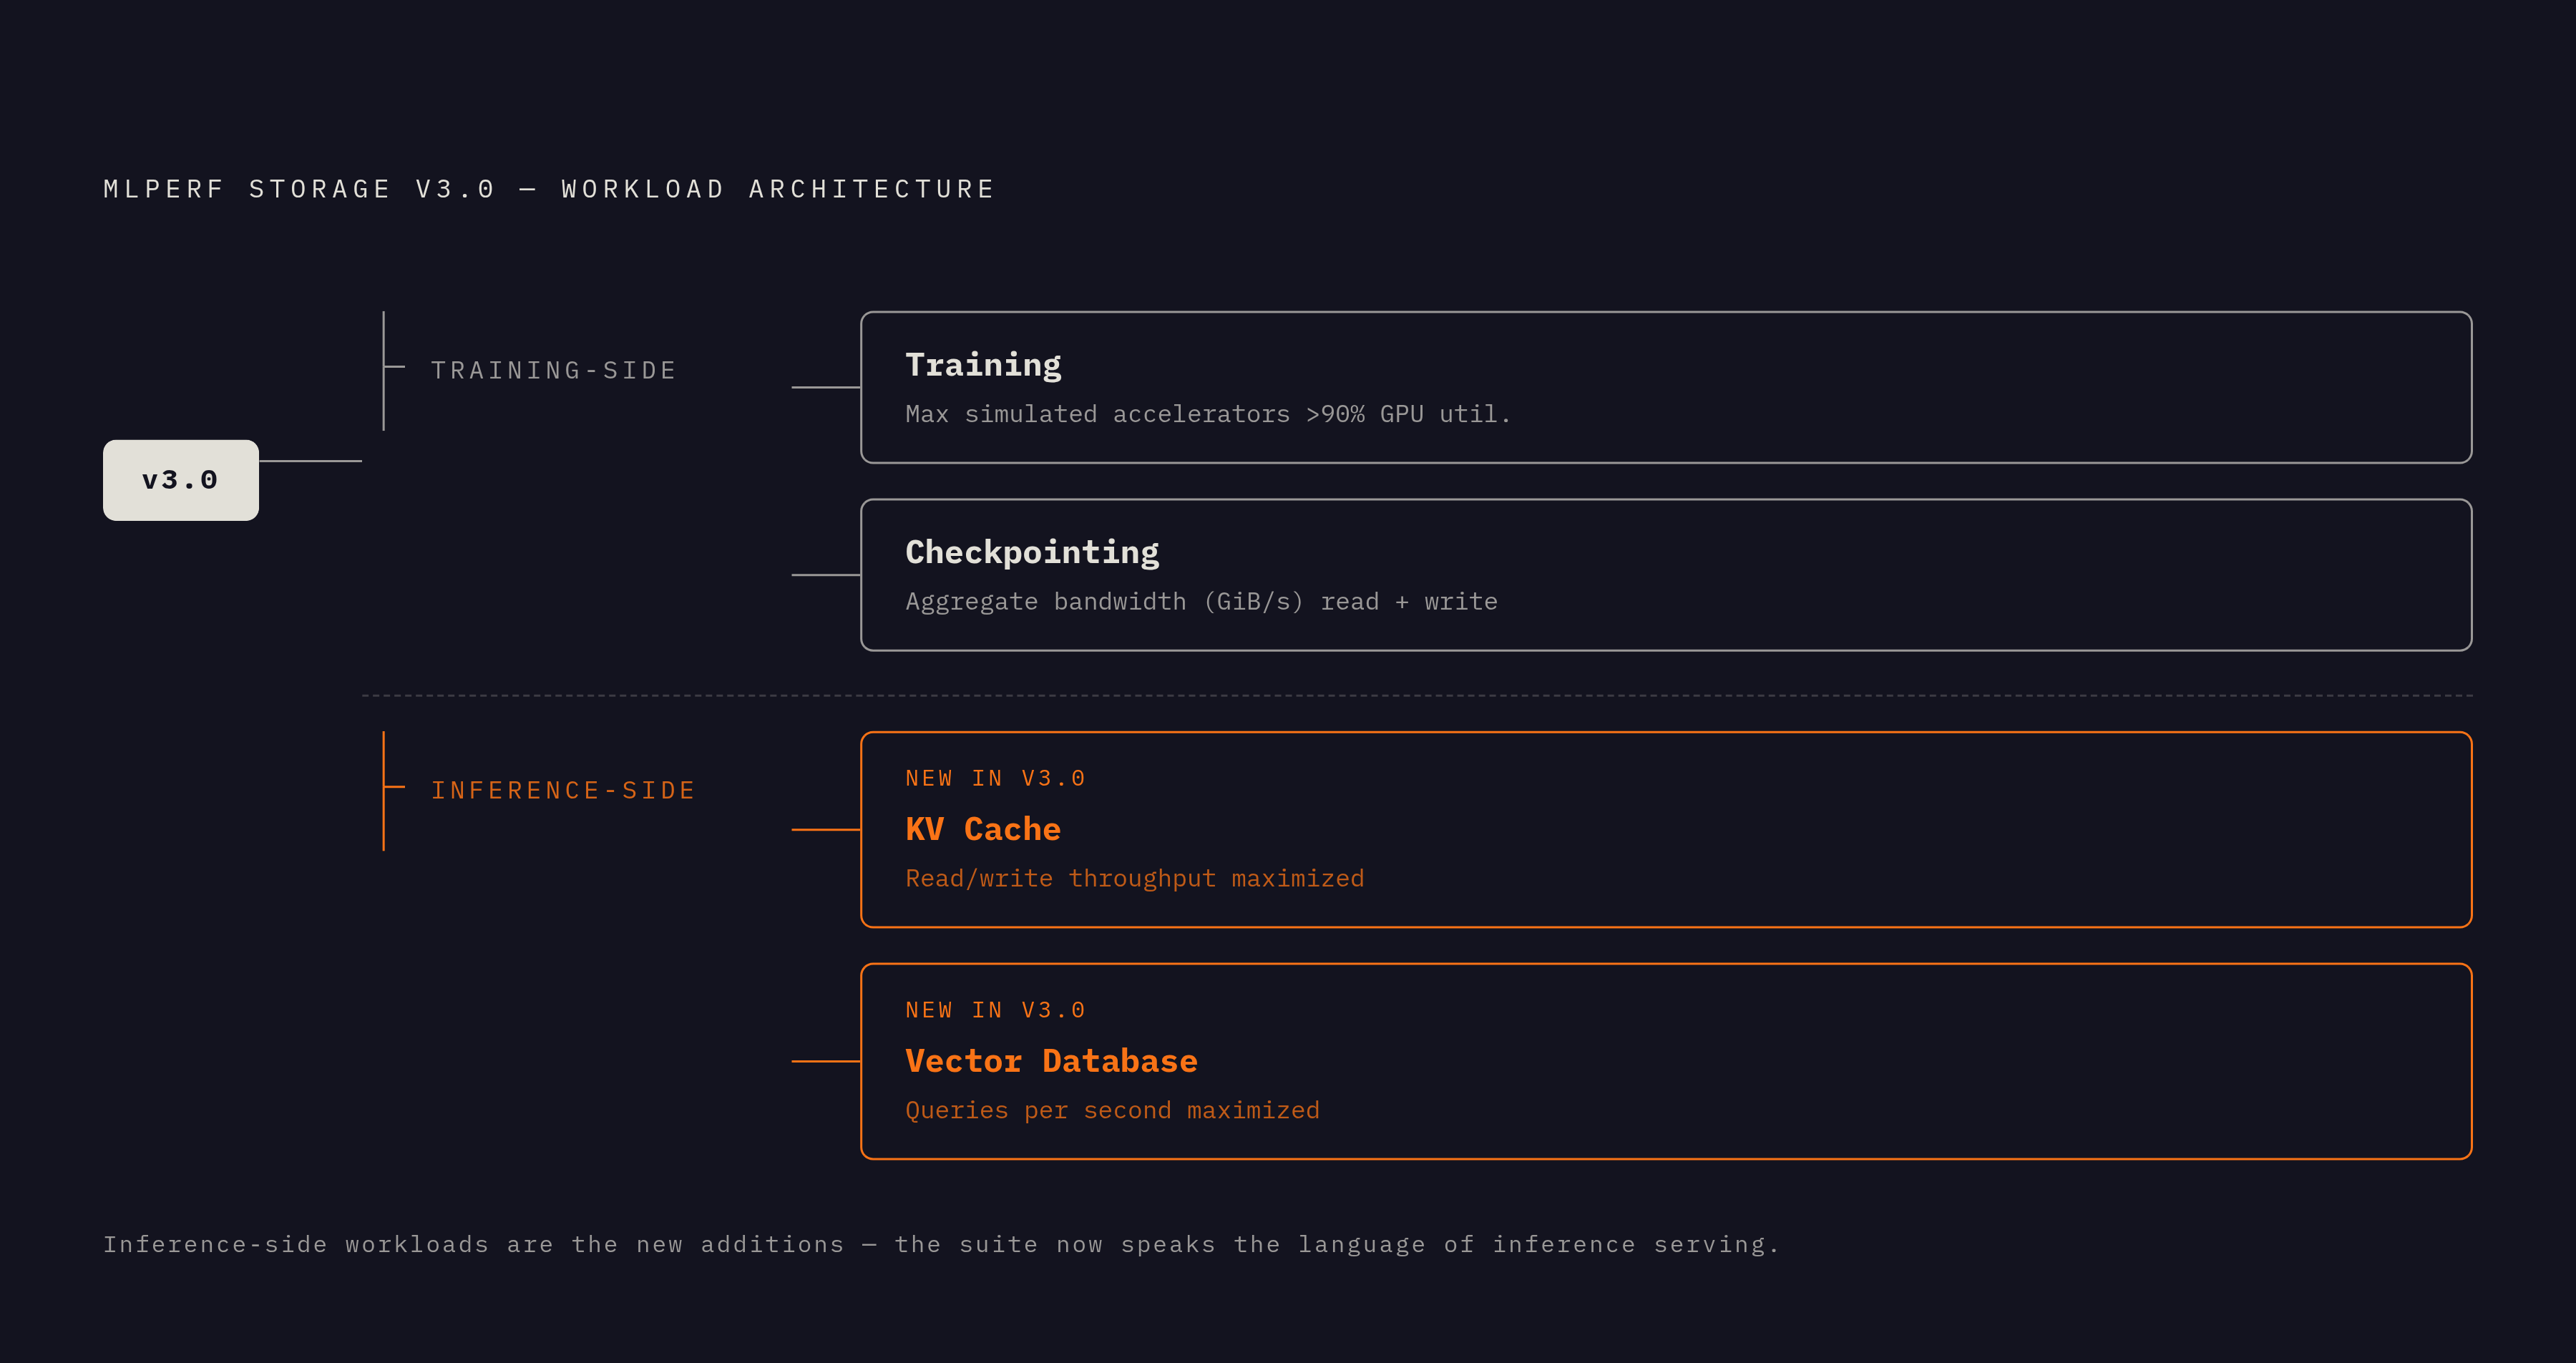
The four workloads in detail: what each one tests and exposes
The two models stress storage in almost opposite ways. A storage system that handles one well won't necessarily handle the other.
At the 8B scale, the test runs 8 processes writing and reading across 16 files, and the protocol itself is ten checkpoint writes followed by ten reads, with the reported result averaged across both directions storagenewsletter.com. What this exposes is how a storage system behaves under the specific load pattern of a training job saving state, or recovering from a failure, at full scale, and that load grows faster than linearly as model size increases.
The Vector Database workload uses a Milvus database loaded with 10 million vectors at 1,536 dimensions in float32, each vector around 6 KiB, which works out to roughly 61 GB of raw vector data before any index overhead is added storagenewsletter.com. It's indexed with DiskANN, a structure built specifically to live on disk instead of in memory, so storage latency and bandwidth sit directly on the critical path of every query. Its primary metric is queries per second, maximized, with latency and recall percentage reported alongside it. Only four organizations submitted VDB results in this round (NewFW, Samsung, Suzhou Zishan, and TTA), which makes this the least mature workload in the suite. The results here shouldn't be read as representative of the field yet.
The KV Cache workload measures storage read and write throughput specifically for LLM inference cache operations, and the metric to maximize is that throughput. The architectural reason this matters: KV caching stores the key and value attention matrices from earlier forward passes so the model doesn't recompute them at every decode step, and it's the dominant throughput technique in production LLM serving today. At scale, that cache frequently ends up larger than the model weights themselves in memory footprint. Offloading it to storage stops being optional once batch sizes or context lengths grow. Companies like Open Lake, which builds KV cache storage infrastructure spanning GPU memory and NVMe tiers specifically to absorb that offload pressure in open-source inference stacks, have staked their architecture on exactly this constraint. For practitioners, the practical consequence is straightforward: storage throughput sets a hard ceiling on how many concurrent requests a system can serve once GPU HBM alone can't hold all the active KV state. The models used are UNet3D and RetinaNet. The primary metric is the maximum number of simulated accelerators that sustain greater than 90% utilization. The pass/fail criterion is greater than 90% simulated GPU utilization. Results are simulated against NVIDIA B200 or AMD MI355 GPU I/O demand profiles MLCommons Releases New MLPerf Storage v3.0 Benchmark Results. UNet3D is the most I/O-intensive workload in the suite, characterized by large sequential reads, while RetinaNet is latency-bound, made up of many small files requiring high-IOPS throughput. The benchmark emulates Llama 3-style model families at 8B, 70B, 405B, and 1,250B parameters.
Benchmark architecture: DLIO, dataset scaling, and GPU simulation
The whole suite runs on top of DLIO, the Deep Learning I/O benchmark framework, and each workload's configuration lives as a YAML file inside a folder called storage-conf. The wrapper script that actually launches things is called mlpstorage, which calls dlio_benchmark under the hood (older versions relied on a script called benchmark.sh). It's worth being clear that this is an I/O simulation harness, not a training framework in its own right.
No physical GPUs are involved anywhere in the process. The benchmark simulates the I/O demand that real GPUs running real training jobs would generate, so each simulated accelerator places the same load on storage that an actual one would. It's also the design's clearest limitation, because inference I/O patterns are being approximated rather than actually executed. Dataset sizing follows the same anti-gaming logic throughout: MLPerf Storage generates a "nominal dataset," synthetic file populations whose size distribution mirrors real-world data, and scales that dataset automatically so the system under test can't just cache the whole thing in memory and cheat the result.
Distributed execution has a specific shape to get right before a run starts. The benchmark script runs on exactly one launcher client host, and that host calls mpirun internally to spread work across the rest of the participating client machines, while still participating in the workload itself. None of that works unless passwordless SSH is set up from the launcher to every other client host ahead of time, which is a hard prerequisite, not a nice-to-have.
One nuance that trips people up during result comparisons: both PyTorch and TensorFlow data formats are supported, but they place substantially different loads on the storage system underneath. Comparing a PyTorch result against a TensorFlow result is invalid even when both sit inside the CLOSED division. It's an easy detail to overlook and it can quietly invalidate an otherwise careful reading of the results.
CLOSED vs. CLOSED vs. OPEN division selection
CLOSED submissions exist to create a level playing field. Every result in that division is directly comparable to every other, and that comparability is bought by giving up flexibility: the configuration is fixed.
That distinction has a very practical consequence when reading a published results page. A CLOSED result from one submitter is only meaningfully comparable to a CLOSED result from another submitter, and mixing divisions when reading a leaderboard is one of the more common ways people misread this benchmark. OPEN makes more sense for teams using the benchmark as an internal diagnostic tool to understand their own infrastructure, rather than making a competitive claim, and it's the right choice when testing non-standard storage topologies or access layers.
The new S3 access layer actually opens a genuinely new kind of CLOSED comparison: teams can now put a POSIX-based system and an S3-based system head to head on the same workload, within the same division, and get a result that's directly comparable. For anyone weighing object storage against a filesystem-based approach for AI workloads, that capability didn't exist in earlier versions of the suite. The OPEN division allows deviations from fixed constraints, useful for exploring what a system can do, but its results are not directly comparable to CLOSED submissions from other vendors.
Environment configuration and pre-run setup steps
Before anything else runs, passwordless SSH needs to be working from the launcher client to every participating host, since the distributed execution model the benchmark depends on simply doesn't function without it. This isn't an optimization step to circle back to later. Without it, the distributed execution model the benchmark depends on simply doesn't function.
That config file is where the synthetic dataset profile, the I/O access pattern, and the simulated accelerator count all get set.
MLPerf Storage permits a data warm-up phase before the official test run starts. In larger deployments, that generally means pre-loading cold data out of object storage and into a distributed cache layer so the benchmark window itself sees stable, high-bandwidth, low-latency access rather than cold-start behavior. Skipping this step is a common way to end up with results that look artificially poor and don't reflect steady-state performance. Anyone benchmarking for a procurement decision should document whether warm-up happened, because a number without that context is close to meaningless.
Network fabric choice moves results more than people expect. InfiniBand setups deliver higher raw bandwidth than Ethernet, but at a real cost premium in hardware storagenewsletter.com. The Quobyte v2.0 result, which hit 90.29 percent GPU utilization over a 200 Gb/s RoCE network, is worth citing here because it shows that Ethernet can clear a demanding utilization bar when the storage software layer is tuned well storagenewsletter.com. It's proof that the network fabric alone doesn't determine the outcome.
On accelerator count, the sensible approach is to start from the accelerator count expected in production and check whether storage clears the 90 percent utilization threshold there, before pushing the count higher to find the actual ceiling. Once a run finishes, expect a specific output structure: a mlperf_storage_report.json file carrying the overall pass/fail result and statistical summary, plus per-run folders holding the active config.yaml, hydra.yaml, and overrides.yaml files that describe what ran. System descriptions get published in both a human-readable PDF and a machine-readable JSON, so there's no ambiguity about what hardware and software stack produced a given number.
Reading the output: what each metric means
For the Training workload, the number that matters most is GPU utilization percentage, and the pass/fail gate is sustained utilization above 90 percent. A failure here has one plain reading: storage isn't delivering data fast enough to keep the simulated accelerators busy, and the bottleneck sits squarely on the storage side, not compute. Aggregate read bandwidth and samples per second are worth reading alongside the pass/fail number, since they show how much headroom exists above or below the threshold.
Checkpointing reports aggregate bandwidth in GiB/s across both write and read directions, averaged over ten runs of each storagenewsletter.com. Duration is really the operational number people should care about: how long does it take to save a model's state, or restore it, under full load? Write and read bandwidth often diverge noticeably, and since read (restoration) speed is what determines how quickly training resumes after a failure, that direction deserves more weight in any resilience planning than the write number does.
A configuration that maximizes QPS at the cost of recall is not a valid operating point for production retrieval systems. Because DiskANN's index lives on disk rather than in memory, storage IOPS caps query throughput directly, which sets this workload apart from most database benchmarks that are fundamentally memory-bound.
KV Cache reports read and write throughput as its core metric, maximized. For an inference operator, that number answers one very specific question: can the storage tier sustain KV offload at the rate the serving system is generating and pulling cache state? A throughput ceiling here becomes a ceiling on concurrent request capacity, full stop. A caveat came out of Solidigm's SSD-focused MLPerf evaluation: at the system level, inference performance stays largely unaffected by disk configuration as long as all KV state fits inside GPU HBM. The storage KV cache result only becomes the deciding factor once contexts get long, batches get large, or memory constraints force offload in the first place.
Power efficiency numbers are also pulled out separately. There's real optimization headroom left in the field, and anyone procuring a system should ask for this figure directly rather than settling for a peak throughput number alone. v3.0 on-premises submissions for the checkpointing write test achieved a median of 14 GB/second per watt, with a maximum of 201 GB/second per watt MLCommons Releases New MLPerf Storage v3.0 Benchmark Results. The UNet3D read test recorded a median of 34 GB/second per watt and a maximum of 277 GB/second per watt MLCommons Releases New MLPerf Storage v3.0 Benchmark Results HPCwire - Since 1987 – Covering the Fastest Computers in the World and the People Who Run Them.
What v3.0 submitted results reveal about storage system capabilities
Volumez, running on AWS in the Training category, posted 1.079 TB/s of throughput, 92.21 percent GPU utilization, and 9.9 million IO/s storagenewsletter.com. That combination matters beyond the raw numbers: it shows cloud-hosted storage clearing the utilization threshold comfortably while sustaining IOPS at a level that used to be associated mainly with on-premises, purpose-built systems. For teams weighing AWS against a self-managed storage build for training infrastructure, that's a meaningfully different starting point than a few years ago.
Everpure's FlashBlade//EXA took first place in the Checkpointing category across both the 405B and 1.25T parameter model classes, and also led in the KV cache category. Landing at the top across the two largest checkpointing tiers and the newest inference-facing test in the same round says something about where that platform's engineering priorities have been pointed: checkpoint recovery time at the largest model scales, and the read/write pattern behind LLM cache offload, sit near the center of where the field's attention is heading next. SOURCE PAGES (what the pages behind the outline's links say).