Designing a KV Cache Throughput Harness for Production Serving Nodes
Naive peak-memory tests miss the churn that actually hurts latency.

A KV cache stores the key and value vectors a model computes during prefill so that every later decode step can reuse them instead of recomputing attention from scratch, and that single design choice is the whole trade: GPU memory spent so GPU compute doesn't have to repeat itself. The trouble is that this trade doesn't stay fixed. Memory footprint scales linearly with context length, and every new model generation seems to arrive with a wider context window than the last, so the problem doesn't level off, it keeps resetting to a bigger number. Batching makes the arithmetic worse in a way that single-request math hides entirely: dozens of concurrent sessions, each holding its own growing prefix in memory, will exhaust HBM well before any one request's footprint would suggest trouble.
None of this is news to anyone who has run a serving node past a few hundred concurrent sessions. What's less appreciated is how badly a naive measurement setup misreads the situation. A harness that just watches peak memory allocation sees a number that looks fine right up until it doesn't, because the real damage happens in the dynamic, not the peak. Eviction, offload, re-prefill events, the churn of blocks moving between memory tiers under pressure, cause latency, and this latency appears in the dynamic behavior of the system, not in any single allocation snapshot. Building a harness that catches this means treating the cache as a moving system.
The two phases of inference and their differing failure modes under load
Inference splits into two phases that behave almost like two different workloads wearing the same GPU. Prefill is compute-bound: it processes the whole prompt in parallel, generates a key and value vector for every input token, and populates the cache in one dense burst of work. This phase is the source of nearly all the variability a user notices in time-to-first-token.
Decode is the opposite animal. It's memory-bandwidth-bound, issuing thin matrix-vector operations one token at a time, and on every single step it has to read the entire live KV cache back off memory. That read cost doesn't shrink as the conversation goes on, it grows, and it's the reason inter-token latency creeps up and throughput collapses once batch pressure gets heavy enough. Prefill wants raw compute. Decode wants bandwidth. A harness that only tracks one or the other is measuring half the system.
Disaggregated prefill/decode architectures like Mooncake and NVIDIA Dynamo exist because of this asymmetry: they split the two phases across different nodes because their resource demands are incompatible at scale, and a harness on a monolithic node conflates what disaggregated systems keep separate. A harness running on a monolithic node conflates what these disaggregated systems deliberately keep apart, so if the production target is disaggregated, the measurement setup needs to know that going in.
Agentic workloads complicate the picture further, breaking the clean prefill-then-decode story. Repeated tool calls, mid-session context edits, and position shifts mean a single session can cycle through re-prefill events in the middle of what looks like ordinary decoding, and each of those events spikes time-to-first-token in a way that's hard to predict from the prompt alone, a pattern documented in the Leyline research. Any harness built around the assumption that prefill happens once, at the start, and decode just runs afterward, will miss this. This asymmetry means that neither GPU compute throughput nor memory bandwidth alone predicts end-to-end serving throughput, so a harness must track both phases separately and their interaction.
The shape of a realistic workload distribution and the gap left by synthetic load
Most synthetic benchmarks reach for fixed prompt lengths, uniform concurrency, and simple chatbot-style turn-taking, and none of that resembles what a production serving node actually sees. Real traffic is a mess of distributions layered on top of each other: short-prefix requests that turn over fast, long-context sessions held by a single tenant, prefix-sharing loops from multi-tenant agent traffic, and agentic workloads that get interrupted mid-stream by tool calls. A harness calibrated on a clean chatbot trace is calibrated on the wrong workload.
The gap isn't cosmetic. Agentic workloads demand over an order of magnitude more context than single-turn chatbot traffic, according to the OasisKV research, and a harness that never generates that kind of context volume will never put real pressure on the HBM-to-NVMe offload path, the exact path where production systems actually fail. This is the trap: a benchmark can report clean numbers for months and still say nothing useful about the workload that eventually breaks the node.
Scale of testing matters here too. The UNISON benchmark ran across 1,415 sessions and 33,596 turns pulled from coding traces (SWE-bench) and general-mission traces (GAIA), and that breadth is what reveals session-level KV residency failures in the accumulation across sessions, failures that per-request metrics simply can't see. A handful of synthetic sessions replayed in a loop will never expose the same failure modes, because those failures live in the accumulation across sessions, not in any single request.
Prefix cache hit rate is one of the clearest examples of how workload-sensitive these numbers are. Agent loops, multi-tenant SaaS traffic, and long-document Q&A all tend toward high hit rates, while diverse single-turn traffic does not, and a harness needs to inject both kinds of load to see where the hit rate actually falls in production. Concurrency shape carries just as much weight as concurrency depth: bursty arrival patterns generate eviction pressure spikes that a steady-state ramp never produces, no matter how high that steady state climbs. None of the metrics discussed next mean anything if the load driving them doesn't resemble the traffic the node will actually see.
The metrics that correlate with user-visible latency across the memory hierarchy
Start from what the user actually experiences, then work backward to what causes it. Prefill is compute-bound, processes the full prompt in parallel, generates K and V vectors for every input token, and populates the cache, making it the source of time-to-first-token (TTFT) variability. Time-per-output-token is the decode-side equivalent, and it's governed directly by HBM bandwidth utilization and by how much KV data has to be read on every single step.
The metrics behind those two user-facing numbers explain why they move. HBM residency ratio, the fraction of the live KV working set that actually fits in HBM at a given moment, is the first one to watch, because once that ratio drops below what the working set demands, evictions start and TPOT climbs, not gradually, but nonlinearly. Eviction rate and eviction pressure, broken down by where evicted blocks land (CPU DRAM, NVMe, or dropped entirely), function as a leading indicator: they tell the harness a stall is coming before the stall actually shows up in latency.
Decode stall cycles are GPU cycles spent waiting for KV data to arrive from a lower memory tier rather than executing attention, and this is the metric that directly links storage throughput to GPU utilization loss.
Prefix cache hit rate earns its place here too, because it separates workload-driven throughput from infrastructure-driven throughput. Prefix cache hit rate distinguishes workload-driven throughput from infrastructure-driven throughput; a high hit rate that coexists with high TPOT points to a bandwidth problem, not a cache miss problem. Finally, none of these numbers should get reported as a mean and left there. Per-tier latency distributions, the p95 and p99 for reads from HBM, DRAM, and NVMe, matter because tail latency in the storage tier raises p99 TPOT directly, and averages will hide exactly the spikes users notice. Offload bandwidth utilization is measured separately on the HBM→CPU DRAM path and the DRAM→NVMe path and should be tracked against the hardware ceiling for each link to identify which tier is the binding constraint.
Instrumenting HBM residency and eviction pressure without distorting the measurement
Monitoring peak HBM allocation and calling it done is the single most common mistake in this kind of harness. A system can report a healthy peak utilization number while quietly cycling through rapid evict-and-reload events that collapse throughput without ever touching the peak figure the dashboard shows.
The fix starts at the block allocator, not at the attention kernel. What needs recording is block allocation rate, free-block count over time, the trigger event for each eviction, and the destination tier for every evicted block. Putting those four together reconstructs the residency timeline the peak-allocation number was always missing.
A practical rule of thumb from production deployments is to reserve 40-60% of GPU memory for the KV cache, leaving the remainder for weights and activations; a harness should track whether the live working set stays within that envelope under load. Paged allocation schemes, PagedAttention and its derivatives, make this instrumentation genuinely cheap, because each logical block maps to a physical slot, and that mapping means harness hooks belong at the block table rather than buried inside the attention kernel itself.
Eviction observability needs one more layer of detail beyond the raw count. The harness has to record which policy triggered each eviction, whether that's LRU, plain recency, something semantic-aware, or session-aware logic, along with the reuse distance of the evicted block. Without that context, an eviction rate is just a number with no explanation attached to it.
Instrumentation that grabs locks on the block table while the system is under measurement load will distort the very timing it's trying to capture. Lock-free ring buffers, or sampling at a fixed interval instead of on every event, avoid turning the measurement into the bottleneck.
One architectural wrinkle deserves particular attention. Without accounting for the architecture's actual cache layout, reported residency figures will be misleading, and frameworks can over-provision by as much as 57× (per S1). Getting the cache layout right isn't an optional detail here, it separates a residency number that means something from one that is actively misleading.
Measuring offload bandwidth and decode stall cycles across the HBM-to-NVMe path
Following a single decode step through the tiers makes the instrumentation points obvious rather than abstract. The step needs a KV block. If it's hot, it's sitting in HBM and the read finishes in the time the attention kernel expects. If it's warm, it has already spilled to CPU DRAM, and the block has to travel back across that link before attention can proceed. Shared or persistent state may even sit on networked storage. Every one of those hand-offs between tiers is a distinct latency event, and the harness has to timestamp each one rather than lump them into a single "fetch time".
OasisKV's roofline framing gives this walk-through a formal shape: decode throughput is capped by Token-KV intensity multiplied by KV-cache bandwidth across three memory-tier roofs, and separately by the dense and sparse throughput ceilings set by compute and weight-loading time. A harness that computes this ratio at runtime, rather than just totaling offload volume after the fact, can point at which tier is actually the binding constraint instead of leaving the team to guess.
Per-step accounting should record, for every decode step, how many bytes moved from each tier, how long the transfer took, and whether that transfer landed before the attention kernel actually needed the data. That last check is what turns a bandwidth number into a stall number, because a transfer that completes a millisecond late is functionally the same as a transfer that never happened.
On the NVMe side, io_uring or GPUDirect Storage counters, where the hardware supports them, give visibility into queue depth, the completion latency distribution, and whether the drive is actually delivering its sustained sequential throughput or whether random-access patterns are quietly degrading it. DMA transfers timed to happen during inter-turn tool-call idle windows, the approach UNISON's TIDE component takes advantage of, can turn otherwise wasted wait time into useful tier migration, and the harness should measure how much of each idle window actually gets used this way versus how much goes to waste.
Prefetching adds a final layer. Systems like OasisKV use speculative lookahead to guess which KV blocks decoding will need before they're requested, and the harness needs to track prefetch hit rate as a separate number from ordinary cache hit rate. A low prefetch hit rate paired with high offload latency is a configuration problem to fix, not evidence that the workload itself is unreasonable.
Injecting representative concurrency and context distributions into the harness
Concurrency needs to be shaped deliberately. Ramp toward peak gradually first, because prefill-decode contention appears most clearly at the transition point where both phases are competing for the same GPU. Hold steady at peak to get a clean read on sustained throughput. Then push to twice peak in a deliberate spike, because eviction cascades tend to hide until burst conditions force them into view.
Context length needs at least three populations represented, short requests under a few thousand tokens, medium requests in the tens of thousands, and long requests running into the hundreds of thousands or beyond, weighted to match the actual traffic of the target deployment rather than spread evenly across the three. A uniform distribution is easy to generate and almost never resembles anything real.
Prefix overlap deserves its own dial. Configure a fraction of each request cohort to share a common prefix, simulating a shared system prompt, a shared repo context, or a shared document, and sweep that overlap ratio from none to heavy reuse while watching how hit rate and eviction pressure respond to each setting. Agentic sessions need direct simulation too: sessions that issue several sequential requests with steadily growing context, broken up by simulated tool-wait gaps, with UNISON's benchmark corpus serving as a reasonable reference for what a credible agentic load actually looks like at scale.
Arrival timing matters as much as any of the above. Poisson arrivals are the easy default and they understate burst pressure badly; a heavy-tailed inter-arrival distribution, or better, a bursty trace replay, is what actually produces the eviction spikes that expose weaknesses in the storage tier. If the production system splits prefill and decode nodes, the harness must reflect that topology, because KV transfer between the prefill and decode nodes is itself a bandwidth event that belongs in the measurement.
All of these parameters, the concurrency ramp, the context weighting, the overlap ratio, the arrival distribution, belong in version control alongside the harness code itself. A latency number without a reproducible load shape behind it is closer to an anecdote than a measurement.
Interpreting results: what the numbers say about where the real bottleneck lives
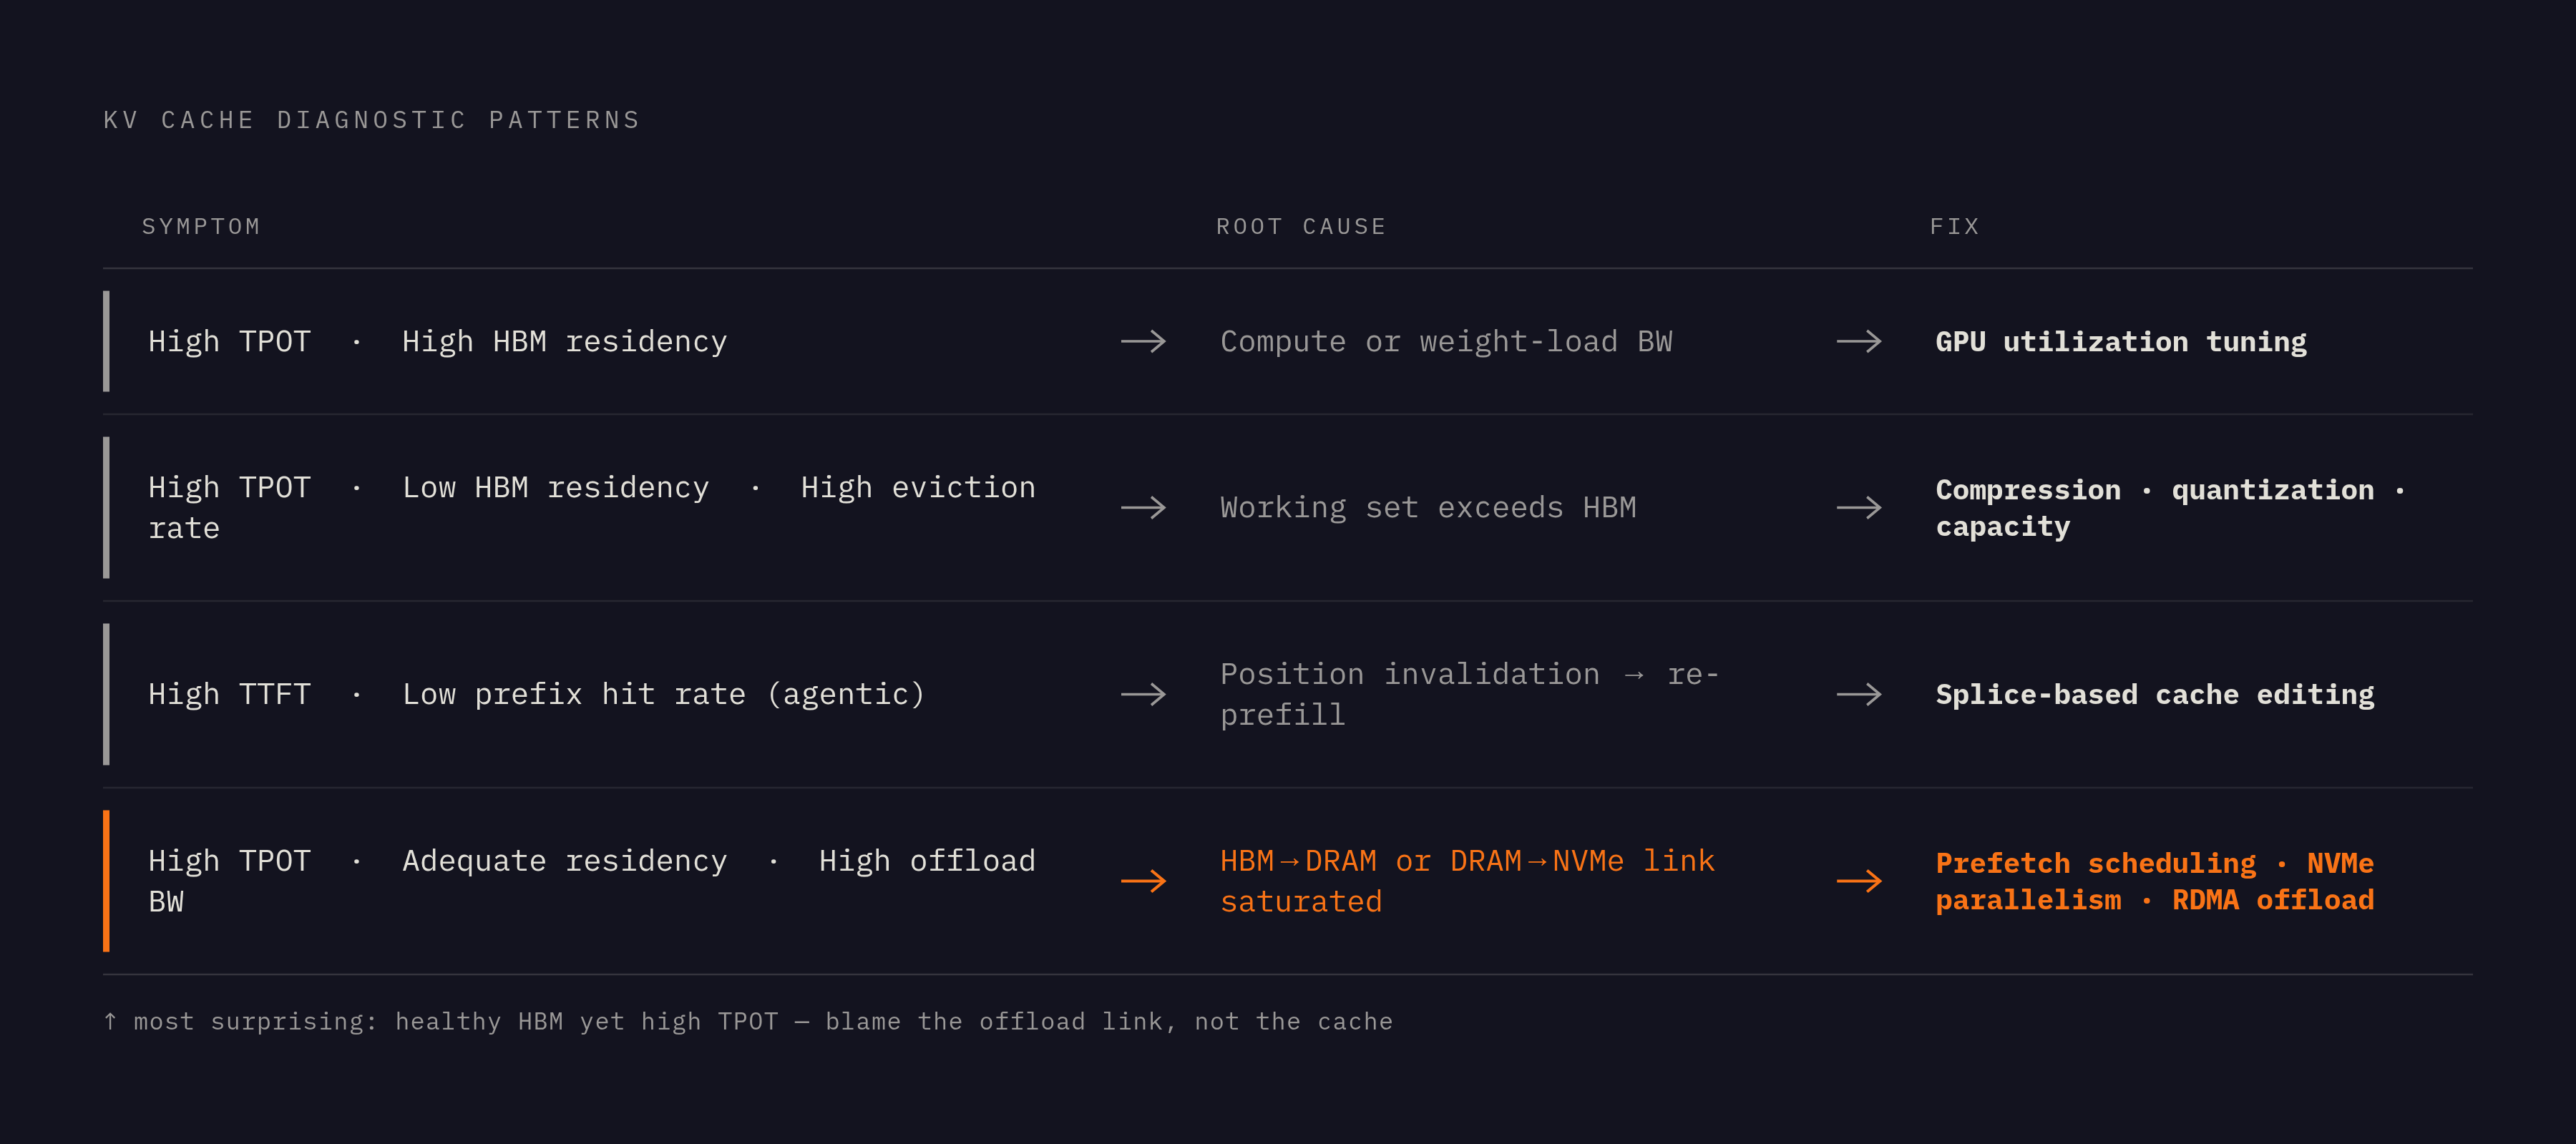
Four patterns tend to recur once the metrics above are collected together, and each one points somewhere different. High TPOT paired with high HBM residency means the bottleneck isn't the KV cache at all, it's compute or weight-loading bandwidth, and the fix lives in GPU utilization tuning, not cache management. High TPOT paired with low HBM residency and a high eviction rate means the working set has outgrown HBM outright, a capacity problem rather than a bandwidth one, and the available fixes are compression, quantization, or adding capacity.
High TTFT paired with a low prefix cache hit rate under agentic load usually traces back to position invalidation, context edits forcing re-prefill mid-session, a pattern the Leyline paper (arXiv:2606.01065) documents directly, with splice-based cache editing as the direction toward a fix.
Quantization is one of the clearest levers a harness can validate directly. MLPerf v6.0, published in April 2026 by MLCommons, showed that quantizing DeepSeek-R1's KV cache from BF16 down to FP8 meaningfully cut the footprint and unlocked higher throughput, and a harness run before and after that kind of change should show the shift in both the HBM residency ratio and the eviction rate. Software stack gains are real and measurable: MLPerf v6.1 (September 2026) showed up to 1.6× higher performance over v6.0 on identical hardware through software optimization, and a well-designed harness should be sensitive enough to detect gains of this magnitude between framework versions.
Scaling checks matter too. Throughput ought to grow close to linearly as capacity gets added within a given tier. When a harness measures sublinear scaling instead, the bottleneck has moved somewhere else in the stack, the kind of increment reflected in the roughly 9 percent software gain MLPerf v6.0 recorded on GB300 NVL72 hardware.
None of this holds up if the results get flattened into one throughput number. TTFT, TPOT, eviction rate, and offload bandwidth need to be reported together, as a joint distribution, because a single aggregate figure erases exactly the interactions this whole harness exists to catch. The bottleneck rarely lives in one metric alone. It lives in how the metrics move together under a load shape that resembles the traffic the node will see in production, and that's the argument for building the harness this way. High TPOT with adequate residency but high offload bandwidth utilization indicates a bandwidth-bound condition on the HBM→DRAM or DRAM→NVMe link, with a solution space of prefetch scheduling, NVMe parallelism, or RDMA offload.